A carrier tells you it delivers in two days. That sentence is missing four things: which zone, which clock, which percentile and which calendar.
Change any one of them and the same network produces a different number. All of those numbers can be true at once, which is why transit claims are so easy to compare badly.
It matters most when you are running a bid or piloting a new carrier, which is when transit numbers tend to arrive with the least context attached.
The zone
A zone is a distance band, and the band depends on where it is measured from.
USPS zones run from the shipper’s origin. UPS and FedEx publish their own zone charts, and they don’t always agree: when I compared the two carriers’ Ground charts from 17 origins, they placed about one origin and destination pair in eleven in different zones.
Some networks measure zones from the point where they inject your parcel, not from your dock, which can make a long haul read like a short one.
“Two days in zone 2” means something different under each of those definitions. That is why the common ruler is the lane itself, not the zone: your origin and destination ZIP pair, read through each carrier’s own zone table.
The clock
Transit can start at label creation, pickup, first scan or arrival at a hub. It can stop at the delivery scan or at the first attempt.
A parcel labeled Friday evening, picked up Monday and delivered Wednesday took two days from pickup and five calendar days from the label. Your customer started counting at checkout.
Most of the time between checkout and the first carrier scan is your own fulfillment time. It belongs in your delivery promise, and it usually sits outside the carrier’s transit number.
The percentile
Take 100 parcels on one lane: 30 arrive in one day, 50 in two, 10 in three, 5 in four, 3 in five and 2 in six.
That lane averages 2.1 days, and its median is two days. Eighty percent arrive within two days. It takes three days to reach 90 percent and four to reach 95.
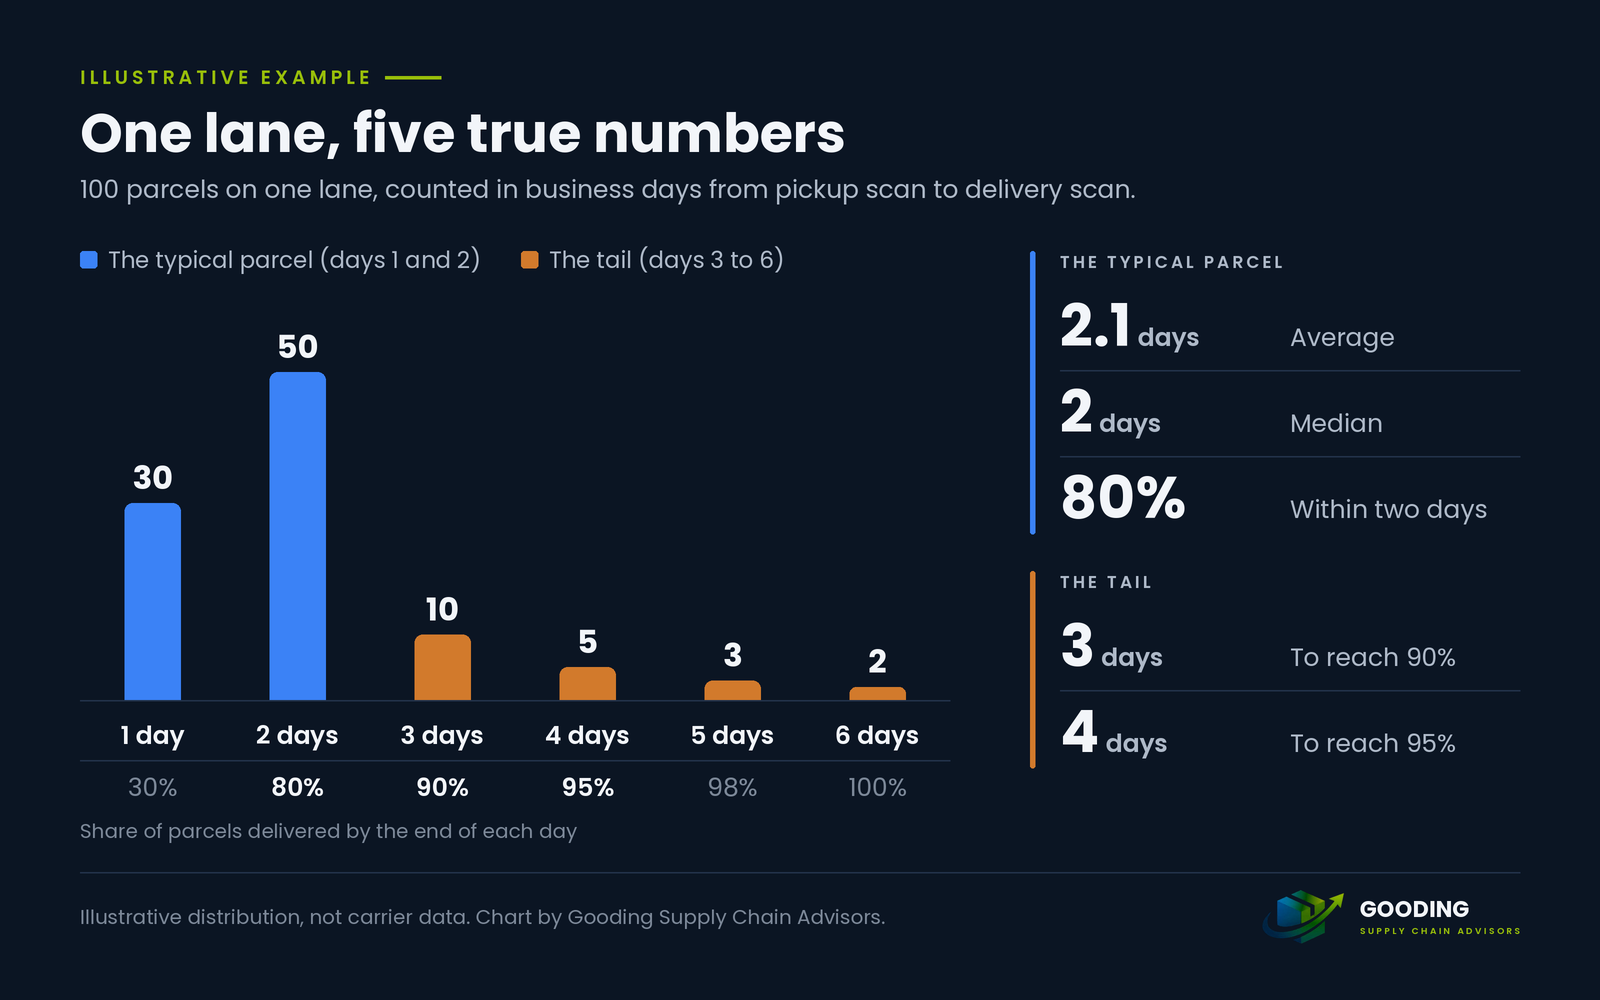
Five true numbers, one lane. A carrier can quote any of them.
The average and the median describe the typical parcel. The calls to your customer service team tend to come from the rest. A delivery date shown at checkout has to hold for the slow parcels too, so set it from the tail, not the average.
The tail is also where carriers earn or lose trust, the gap I looked at in the trust gap piece, and it is the part of the distribution a headline number is least likely to show.
The calendar
Business days and calendar days split apart every weekend. A five-business-day promise made on a Monday runs to the following Monday. Holidays stretch it further.
Weekend delivery changes the math again. A network that delivers on Saturday and one that doesn’t can report the same week of service in different numbers of days.
When the ruler changes the winner
Rulers don’t only change the numbers. They can change the ranking.
Picture two carriers on the same lane. Carrier A averages 2.0 days and needs four days to reach 90 percent. Carrier B averages 2.3 days and reaches 90 percent in three. Compare averages and A wins. Compare the 90th percentile and B wins.
Neither ranking is wrong. They answer different questions, and the tail is the one your customers feel.
Coverage has a ruler too
The same problem shows up in coverage claims. A ZIP code count sounds precise, but ZIP codes range from a handful of residents to more than 100,000.
A count of ZIP codes, a share of the U.S. population and a share of your own destinations are three different numbers, and only the last one describes your business.
What to ask every carrier
- Your lanes, one ruler. Transit by origin and destination ZIP pair on your own lanes, along with the carrier’s zone table. Map each carrier’s pairs through its own table, then compare the carriers pair by pair, so every lane shows each carrier’s zone, price and transit on one row.
- The tail. The 90th or 95th percentile, alongside the average.
- The clock. Where the count starts and where it stops.
- The calendar. Business or calendar days, and how weekends and holidays are treated.
- Coverage against your destinations. The share of your own volume the network reaches, measured against the ZIP list your rates apply to.
- Your own measurement. In a pilot, measure transit from your own order and tracking data, on your own clock, rather than relying on the carrier’s summary.
Ask your incumbent the same questions. The point isn’t to catch a new carrier out. It is to put every carrier on the same ruler before you compare them.
The bottom line
A transit number isn’t wrong because it is flattering, and it isn’t right because it is precise. It is only comparable once you know what it measured.
Asking takes one email per carrier. Skipping it can change which carrier looks fastest.
Takeaway: The number is half the claim. The ruler is the other half.
When a carrier quotes you a transit time, do you know which zone, which clock and which percentile it’s measured on?