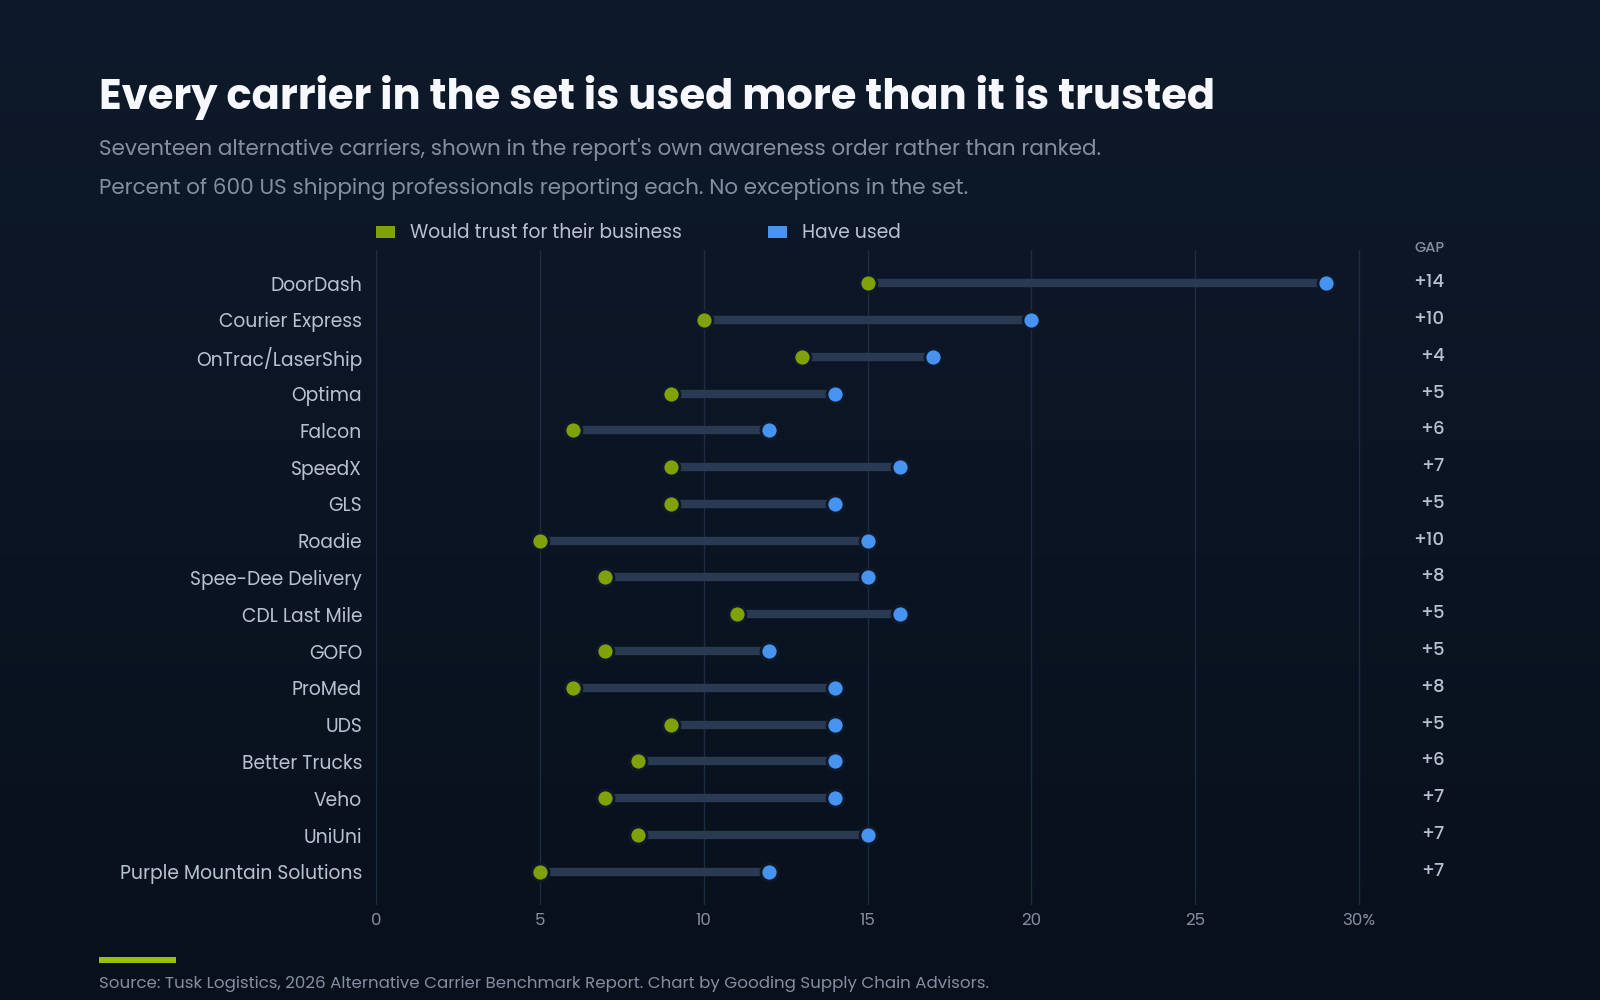
Tusk Logistics surveyed six hundred US shipping professionals last month on seventeen alternative carriers, asking for each one whether they had used it and whether they would trust it with their business.
For all seventeen, more people report using the carrier than report they would vouch for it. Not most of them. All of them.
Average usage came back around fifteen percent against average trust of about eight. The narrowest gap in the set is four points, the widest is fourteen, and there are no exceptions in either direction.
The same respondents rank reliability as the top factor in choosing a carrier, at forty percent, with cost third.
Both of those things cannot be running your routing guide. One of them is what you believe about yourself and the other is what your volume actually did. This article is about the space between them, because that space has a price and most shippers have never calculated it.
| Measure | Value |
|---|---|
| Carriers measured | 17 |
| Carriers used by more respondents than would trust them | 17 of 17 |
| Average reporting they have used the carrier | 15.5% |
| Average reporting they would trust the carrier | 8.5% |
| Average gap | 7.0 points |
| Narrowest gap | 4 points |
| Widest gap | 14 points |
| Median ratio of usage to trust | 1.9 to 1 |
| Widest ratio | 3.0 to 1 |
| Among those aware of a carrier, share who have used it | about 4 in 10 |
| Among those aware of a carrier, share who would trust it | about 2 in 10 |
Source: Tusk Logistics, 2026 Alternative Carrier Benchmark Report. n=600 US shipping professionals, fielded May 2026. Aggregates calculated by Gooding Supply Chain Advisors.
What rate savings actually buy
Start with the only number that settles this.
When you move volume to a cheaper carrier, you are buying rate savings and selling some amount of reliability. The savings are easy to see because they print on the invoice. The reliability is not, because it shows up somewhere else entirely: a re-ship, a support contact, a refund, and sometimes an order that never comes back.
So put them on the same line. Take your per-parcel savings. Divide that by what one failed delivery actually costs you, all in. What comes back is your budget: how far your exception rate can rise before those savings are entirely consumed.
Run it and the number is usually smaller than people expect. Save sixty cents a parcel, and if a failure costs you twenty-five dollars all in, you can absorb about two and a half points of added exceptions. Per thousand parcels that is six hundred dollars saved on freight against twenty-four extra failures costing six hundred dollars. Push the gap to three points and you are down a hundred and fifty. You did not lose it on shipping. You lost it in customer service, and it never appeared in a shipping report.
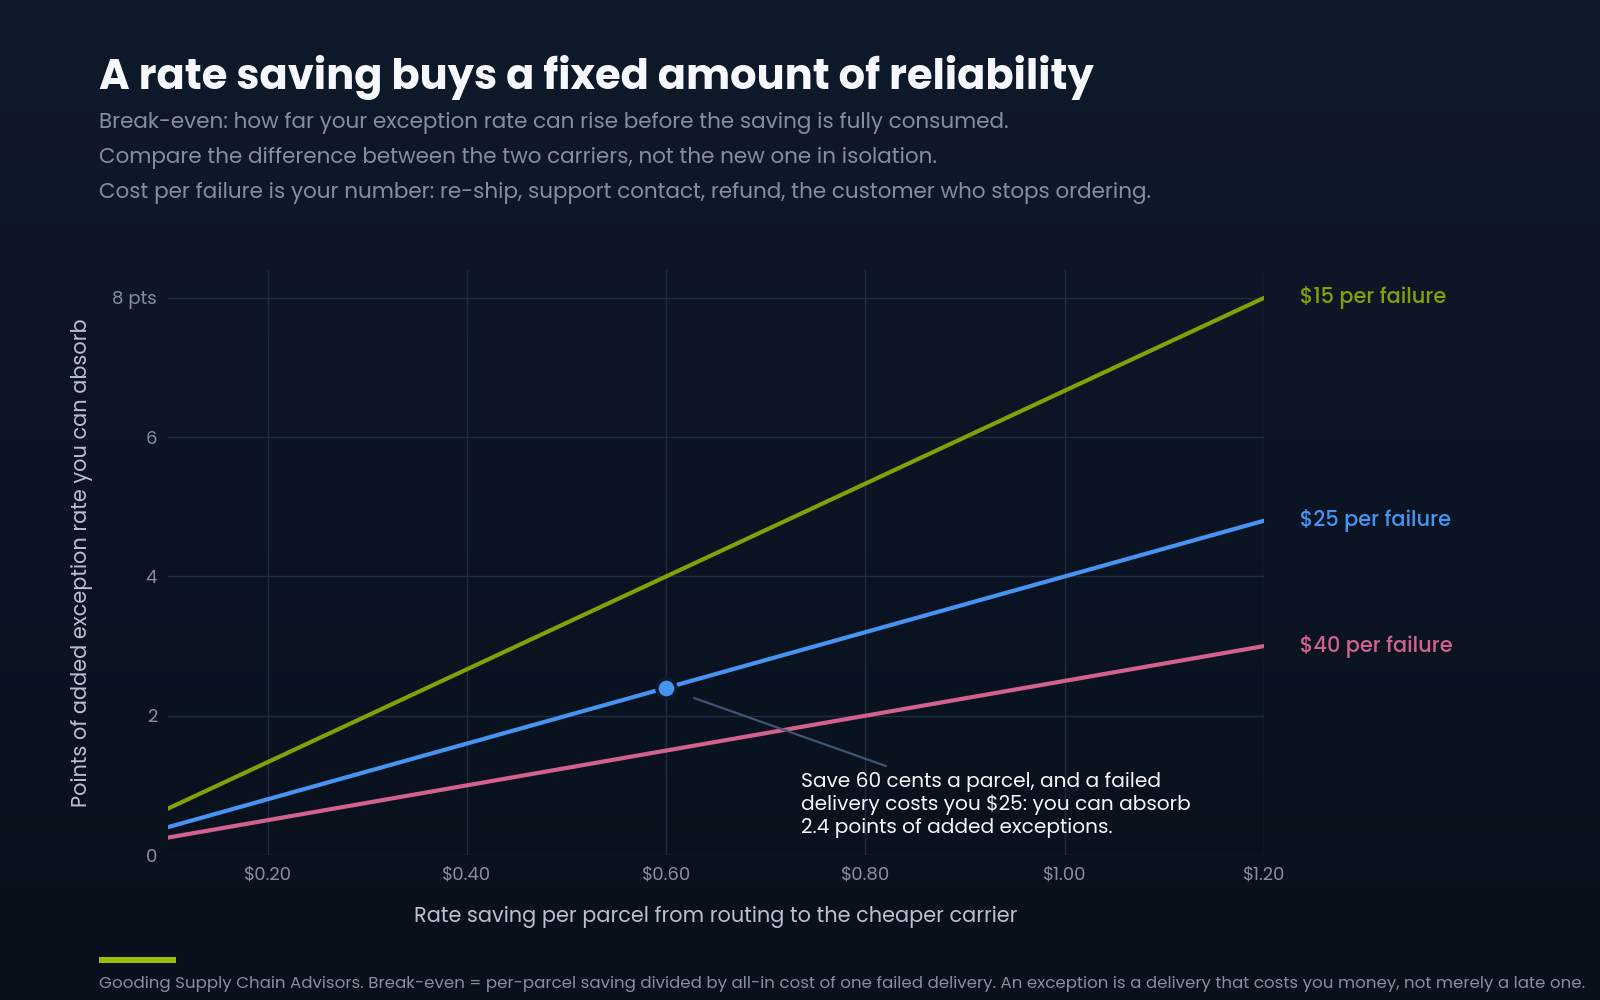
How far your exception rate can rise before rate savings are fully consumed. Find your per-parcel savings down the left, your all-in cost of one failed delivery across the top.
| Rate savings per parcel | $10 per failure | $15 per failure | $25 per failure | $40 per failure | $60 per failure |
|---|---|---|---|---|---|
| $0.20 | 2.0 pts | 1.3 pts | 0.8 pts | 0.5 pts | 0.3 pts |
| $0.30 | 3.0 pts | 2.0 pts | 1.2 pts | 0.8 pts | 0.5 pts |
| $0.40 | 4.0 pts | 2.7 pts | 1.6 pts | 1.0 pts | 0.7 pts |
| $0.50 | 5.0 pts | 3.3 pts | 2.0 pts | 1.2 pts | 0.8 pts |
| $0.60 | 6.0 pts | 4.0 pts | 2.4 pts | 1.5 pts | 1.0 pts |
| $0.75 | 7.5 pts | 5.0 pts | 3.0 pts | 1.9 pts | 1.2 pts |
| $1.00 | 10.0 pts | 6.7 pts | 4.0 pts | 2.5 pts | 1.7 pts |
Break-even equals per-parcel savings divided by the all-in cost of one failed delivery. Compare the difference between two carriers’ exception rates, not the new carrier’s rate alone. An exception is a delivery that costs you money, not merely a late one.
Two things have to be right or the number will flatter you.
It is the difference between the two carriers, not the new carrier’s rate. If the carrier you left ran one percent and the new one runs three, you took on two points, not three. Comparing the new carrier against zero is the most common way this gets overstated.
The rate and the cost have to describe the same event. If you are pricing a failure at twenty-five dollars, then the rate you compare is the rate of deliveries that actually cost you money: lost, damaged, or late enough to trigger a refund, a re-ship, or a support contact. It is not on-time percentage. Most late parcels arrive and cost you nothing, so running an on-time gap against a per-failure cost will tell you the sky is falling when it is not.
Get the failure cost right and the rest follows. It is your number, not an industry figure, and it is worth twenty minutes with your support lead. Most shippers guess low, because the easy costs are the re-ship and the refund, and the expensive one is the customer who quietly stops ordering.
That single calculation converts a vague worry about trust into a threshold you can manage against.
Three reasons this happens, and only one of them is a decision
The gap has three plausible explanations. They call for completely different responses, which is why it is worth knowing which one is you.
You bought the discount on purpose. You knew the carrier was weaker and took the rate anyway. That is a legitimate trade, not a mistake, and if you priced it against the break-even above then you are fine. Most people who say this have not actually run the number.
You are testing where failure is cheap. New carriers get tried on low value items, replenishment, orders nobody is watching a clock on. Nothing wrong with that either, but be honest that it means you have not tested the carrier. You have tested the carrier on the volume you would not miss, which tells you very little about how it behaves on the volume you would.
You did not choose at all. Sixty percent of these respondents sell on a marketplace that controls or influences how orders ship, and a quarter say those requirements significantly shape their strategy. If a meaningful share of your parcels are routed by somebody else, then part of your carrier mix is an outcome rather than a decision, and the fix is not a better carrier conversation. It is knowing which parcels you still control.
Three different problems. Only the first one is solved by negotiating.
You are the one holding the lease
Here is the part worth carrying into your next carrier conversation.
Usage without trust is not market share. It is a lease that renews weekly, and you are the landlord.
A carrier growing on volume that arrived for price has no reservoir of goodwill with you. There is no stored credit, no benefit of the doubt, no earned bad week. That is uncomfortable for them and it is leverage for you, and almost nobody uses it, because most shippers treat a rate they already won as settled.
It is not settled. Ask for the performance commitment now, while you are the incremental volume they are counting on for the year. Service level guarantees, exception reporting you do not have to request, and a named person when something breaks are all considerably cheaper to obtain from a carrier who needs your parcels than from one who has already booked them.
Four things to do before peak
Peak surcharges start in about ten weeks. Whatever volume you moved this year gets its first real test then, on the weeks you can least afford it. All four of these are doable before October.
Put your two lists side by side. Volume by carrier for last quarter, and exception or claims rate by carrier for the same period. If you cannot assemble the second one in an afternoon, stop. That is the finding, and it means you have been routing on price with no counterweight because the counterweight was never measured.
Calculate your break-even, per carrier, on the lanes that matter. Savings divided by all-in failure cost. Then compare it to the actual performance delta between those carriers. Some of your moves will clear it comfortably. At least one probably will not.
Find out how much of your volume you actually direct. Split it into what you route and what a marketplace or a customer routes for you. Your leverage only applies to the first number, and it is often smaller than people assume.
Decide your trigger now, in writing, and where the volume goes. What performance level makes you pull parcels off a carrier, and which carrier absorbs them. Do this in September. In late November you will not have the bandwidth to decide it, and the capacity you would have wanted will already be committed to somebody who called earlier.
About this data, honestly
Tusk fielded the survey in May through Pollfish, a mobile panel, and sixty-one percent of respondents ship under ten thousand parcels a month. That is a small and mid-market picture, not an enterprise one, and the absolute levels should be held loosely.
The comparison holds better than the levels do, because it is internal. Same six hundred people, two questions, same seventeen companies. Whatever a panel does to one side it does to the other.
Two fair objections deserve stating. “Would you trust this carrier” is a higher bar than “have you used it,” so some gap is baked into the wording. That explains a scatter. It does not explain a gap present in every single case, averaging seven points, running as high as three to one. And no incumbent carriers were measured, so there is no baseline here for what normal looks like. That is the single most useful thing the next edition could add.
Which is also the boundary on all of it. Seventeen companies were measured and the pattern holds across those seventeen. Any carrier not on that list was not measured, and this data says nothing about it in either direction.
One clarification is worth having, because Tusk has said elsewhere that trust is no longer the leading barrier to adoption, and that sits oddly beside everything above. I sent this piece to Ben Emmrich, Tusk’s co-founder and CEO, before publishing it, and he made the distinction plainly: those are two different measurements. The barrier question asks about alternative carriers as a category and has run two years now. The used-against-trust table is new this year and asks about specific named carriers. A shipper can be more open to the category and still not vouch for any single brand inside it.
That is not a softer version of the finding. It is a more exact one, and it supplies the mechanism. The category became easier to consider faster than any individual carrier in it earned the volume.
Credit to Tusk for publishing the table, naming the panel vendor, and disclosing the method. This article only exists because they put the data somewhere a reader could disagree with them, and the paragraph above exists because their CEO answered an email from someone about to do exactly that.
Takeaway: Rate savings buy a specific and usually small amount of reliability. Calculate yours before peak tests it for you.
Which carriers in your mix would you actually vouch for, and does your routing guide reflect that answer?